 |
| Fig. 1 Historical sea level records |
The oldest tide gauge station record begins circa 1856, which is 16 decades, or 160 years ago.
The oldest tide gauge station in that graph is "The Battery" which is located in the New York City area.
In technical terms, that one of several records is called "PSMSL tide gauge station Number 12" (New York, The Battery).
 |
| Fig. 2 The Battery, NYC |
A zone mean average (a blending of all individual tide gauge station records in that zone into one flow) is depicted in the first post of this series (Zone AH, Quadrant SE, Subquadrant NE).
In histories, there are many loose ends, staggered beginnings, and the like, so, when dealing with tide gauge station records, one needs to arrange them in a manner that informs the readership.
That is because different places build and install, for example their tide gauge stations, at different times, as Fig. 1 shows.
 |
| Fig. 3 The Fingerprints |
The end to those beginnings is depicted by the small blue squares on the right side of the graph.
If an individual tide gauge record is used to characterize the entire area, a distorted viewpoint can be generated.
What I want readers to grasp is that if one is not careful one can inadvertently isolate a tide gauge station's historical record to its beginning, or to some other annual spot, in a manner that does not sufficiently reflect the total picture.
For example, by way of excluding other much older, or much younger, tide gauge station records, different sea level rise or sea level fall values can be asserted.
 |
| Fig. 4 A two-gauge zone |
In other words, the resulting partial graph can more easily be used to tell a false scientific story unless the blogger points out the context.
For example, Fig. 4 shows a zone with only two tide gauge stations that began to keep records years apart from one another.
If only one of those tide gauge station records is used, to the exclusion of the other, a different picture of what is actually happening in that zone can be alleged.
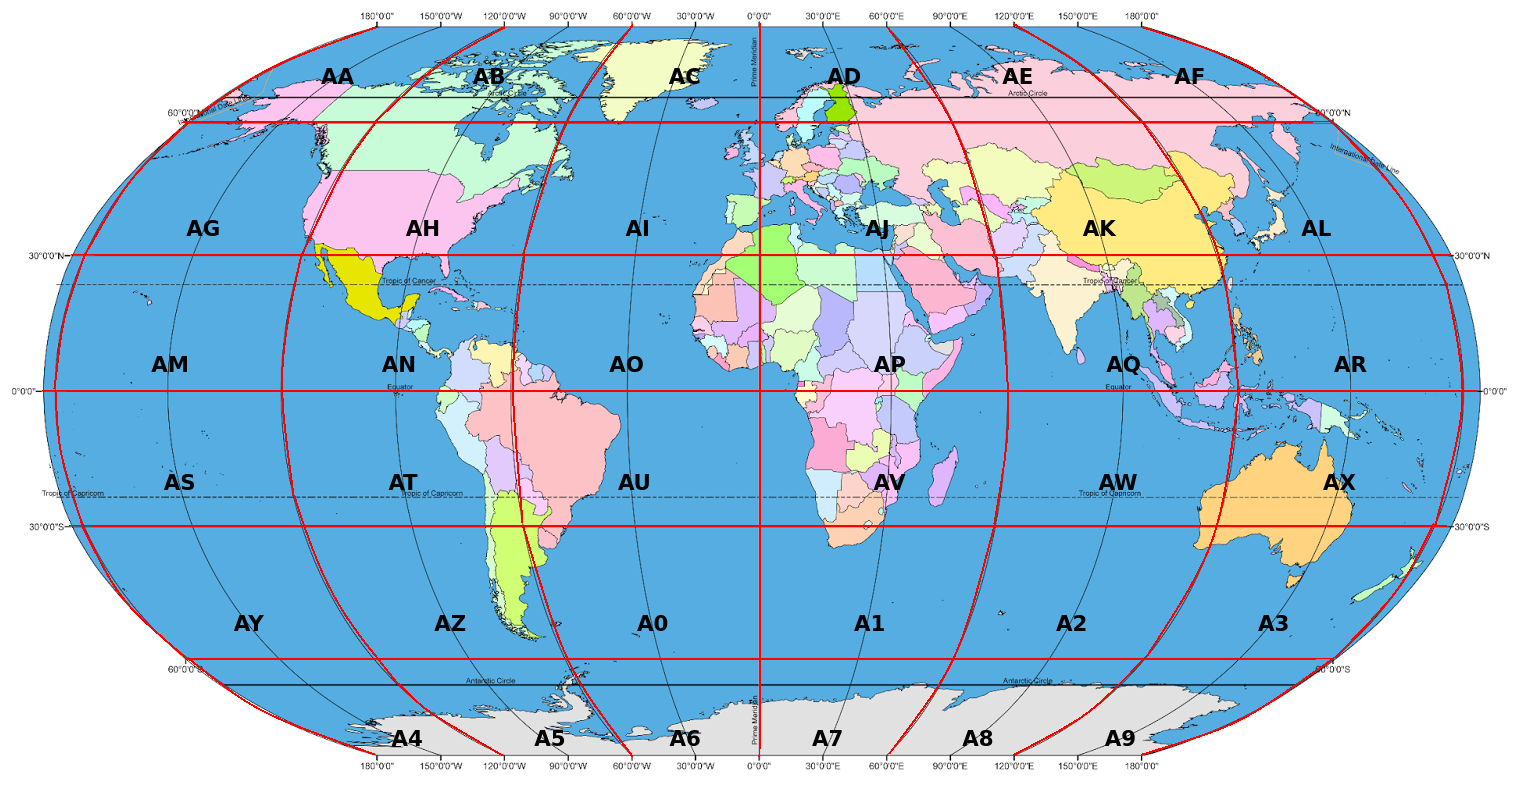 |
| Fig. 5 Dredd Blog zones |
I did that type of sectionalized graphing in SLC Fingerprints R Us, because in that post I was comparing different types of sea level record flows, using global mean average values, and temperature records (BTW, the distinctions were stark).
The purpose of that exercise was to dissect "global mean average" to reveal basic components.
 |
| Fig. 6 Dredd Blog Quadrants & Sub-quadrants |
I wanted to illustrate how it subtly smooths over the real picture of sea level change reality.
The software module I wrote to generate Fig. 1 does the same thing to all of the "Dredd Blog zones" which regular readers hear of from time to time.
Notice that Fig. 3 shows another way to dissect a tide gauge historical sea level record set.
It shows the normal record, then pulls out individual components in terms of their partial contribution to the total picture.
In other words, Fig. 3 is a composite view that shows the whole as well as the parts which add up to the whole.
The whole exercise is conducted to, among other things, expose the fallacy of thermal expansion as a major player in historical sea level change, and to eschew improper use of "global mean average" (cf. On The Evolution of Sea Level Change - 2, The Bathtub Model Doesn't Hold Water).
The previous post in this series is here.
These are the PSMSL stations in Zone AH.SE.NE depicted in Fig. 1:
1) Stn. #1230 : DIGBY
2) Stn. #1158 : YARMOUTH
3) Stn. #1259 : BOUTILIER POINT
4) Stn. #96 : HALIFAX
5) Stn. #1654 : TRENTON
6) Stn. #1153 : CAPE MAY
7) Stn. #180 : ATLANTIC CITY
8) Stn. #366 : SANDY HOOK
9) Stn. #12 : NEW YORK THE BATTERY
10) Stn. #1637 : BERGEN POINT STATEN IS
11) Stn. #519 : MONTAUK
12) Stn. #875 : PLUM ISLAND
13) Stn. #848 : PORT JEFFERSON
14) Stn. #362 : WILLETS POINT
15) Stn. #856 : NEW ROCHELLE
16) Stn. #1068 : BRIDGEPORT
17) Stn. #429 : NEW LONDON
18) Stn. #430 : PROVIDENCE STATE PIER
19) Stn. #351 : NEWPORT
20) Stn. #776 : BUZZARDS BAY
21) Stn. #367 : WOODS HOLE OCEAN INST
22) Stn. #1111 : NANTUCKET ISLAND
23) Stn. #775 : SANDWICH MARINA CAPE COD CANALENTRANCE
24) Stn. #235 : BOSTON
25) Stn. #288 : SEAVEY ISLAND
26) Stn. #183 : PORTLAND MAINE
27) Stn. #1279 : ROCKLAND
28) Stn. #525 : BAR HARBOR FRENCHMAN BAY ME
29) Stn. #1524 : CUTLER II
30) Stn. #1081 : CUTLER
31) Stn. #332 : EASTPORT
No comments:
Post a Comment